Customer Journeys proaktiv optimieren
Genesys Cloud bietet einen erweiterten Satz an Funktionen, mit denen Sie Einblicke in Ihre Customer Journeys gewinnen können. Diese Tools helfen Ihnen bei Folgendem:
- Ermöglicht Ihnen eine umfassende, kanalübergreifende Sicht auf die Reisen Ihrer Kunden.
- Ermöglicht Ihnen, jeden Schritt des Kundenerlebnisses zu verfolgen, zu analysieren und zu optimieren.
- Bietet dynamische Visualisierungen und Heatmaps, die den Grad der Kundenbindung über alle Architect Flow-Komponenten hinweg aufzeigen.
- Ermöglicht sofortige Einblicke in stark frequentierte Bereiche und Interaktionen.
Mit detaillierten und hochrangigen Ansichten können Sie Flow Insights, Journey Flows und den Wiedergabemodus verwenden, um in bestimmte Architect-Flow-Komponenten einzutauchen und Folgendes durchzuführen:
- Messen Sie die Durchflussleistung.
- Überwachen Sie die Häufigkeit wichtiger Flussmeilensteine.
- Verstehen Sie, wie Kunden die gewünschten Flow-Ergebnisse erreichen.
- Visualisieren Sie die Wege, die Kunden nehmen, und erfassen Sie sowohl erfolgreiche als auch herausfordernde Routen.
Nutzen Sie Journey Management, um Ihre Ansicht über Single-Channel-Architect-Flows hinaus mit kanalübergreifenden Daten der letzten 365 Tage zu erweitern und Folgendes zu tun:
- Führen Sie Trend- und Trichteranalysen durch.
- Verfolgen Sie die Reiseleistung im Laufe der Zeit.
- Identifizieren Sie schnell Veränderungen in Ihren Reisemetriken.
- Identifizieren Sie Reibungspunkte bei Mehrkanalübergängen.
- Optimieren Sie das Kundenerlebnis.
- Verbessern Sie die Kundenzufriedenheit an allen Kontaktpunkten.
Gewinnen Sie aussagekräftige Einblicke in Ihre Customer Journeys mit Flow-Einblicke :
Die wichtigsten Vorteile auf einen Blick
Wichtige Anwendungsfälle im Detail
Umsetzbare Erkenntnisse
- Von der Homepage des Architekten , klicken Sie auf oder bewegen Sie den Mauszeiger darüber Flüsse Menü und wählen Sie den gewünschten Flusstyp aus.
- Klicken Sie auf den Fluss, den Sie analysieren möchten.
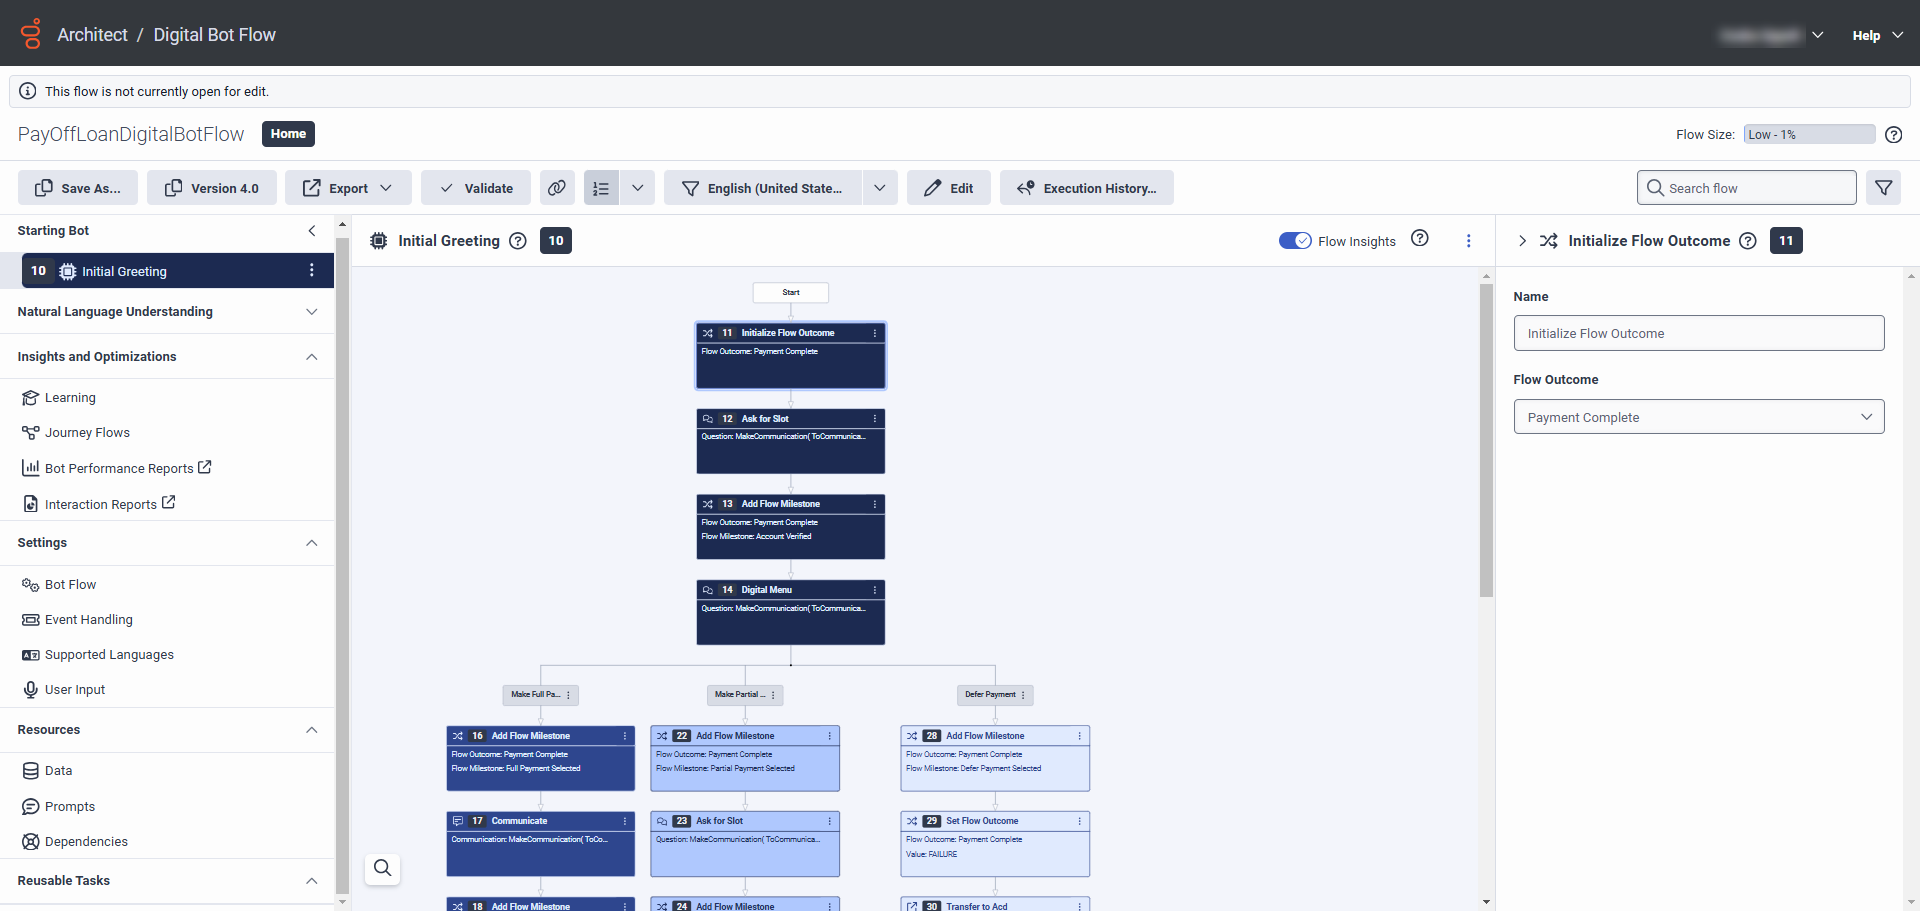
- Verwenden Sie die Flow-Einblicke Umschalten, um die Interaktions-Heatmap für den Flow anzuzeigen. Notiz : Damit die Heatmap angezeigt wird, müssen Interaktionsdaten der letzten sieben Tage vorhanden sein.
- Suchen Sie nach Flusskomponenten mit hoher Frequenz (Interaktionsanzahl) und prüfen Sie, ob in den nachfolgenden Schritten Kunden abspringen. Im folgenden Beispiel gelangen Kunden zum Digitale Menüaktion in einem digitalen Bot-Flow, kommen aber nicht weiter:
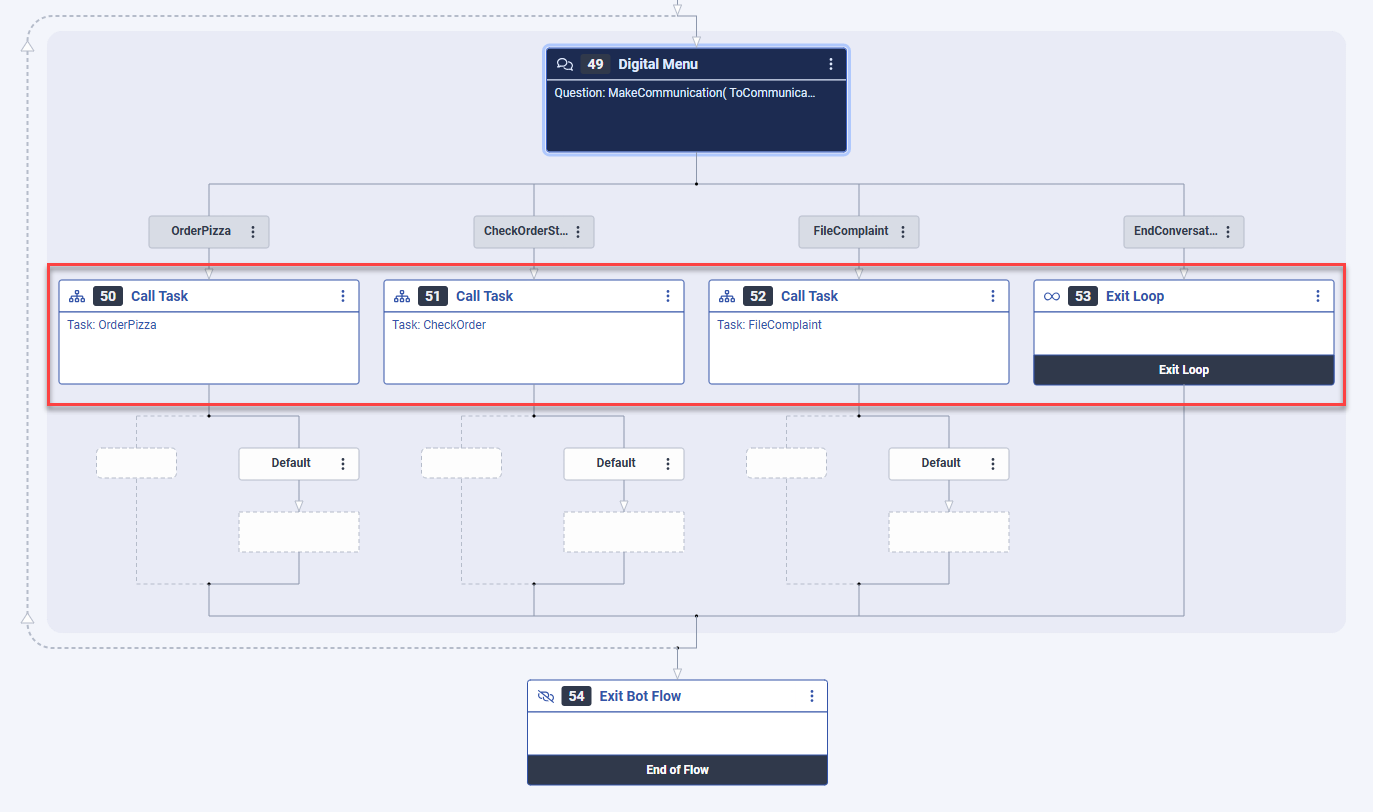
- Untersuchen Sie nun die Aktion „Digitales Menü“, um festzustellen, warum der Fortschritt ins Stocken gerät, und identifizieren Sie alle notwendigen Maßnahmen zum Beseitigen der Reibungspunkte.
Gewinnen Sie aussagekräftige Einblicke in Ihre Customer Journeys mit Reiseabläufe :
Die wichtigsten Vorteile auf einen Blick
Wichtige Anwendungsfälle im Detail
Umsetzbare Erkenntnisse
Angenommen, Sie sind ein Contact-Center-Administrator oder -Analyst, der die Effektivität eines Bots beurteilen möchte. Ihr Ziel besteht darin, die Anzahl der Kunden zu vergleichen, die eine Lösung durch den Bot im Vergleich zu einem menschlichen Agenten erreichen ( ACD ). Verwenden Sie zur Ausführung dieser Aufgabe die Journey Flows-Funktionen.
- Von der Homepage des Architekten , klicken Sie auf oder bewegen Sie den Mauszeiger darüber Flüsse Menü und wählen Sie den gewünschten Flusstyp aus.
- Klicken Sie auf den Fluss, den Sie analysieren möchten.
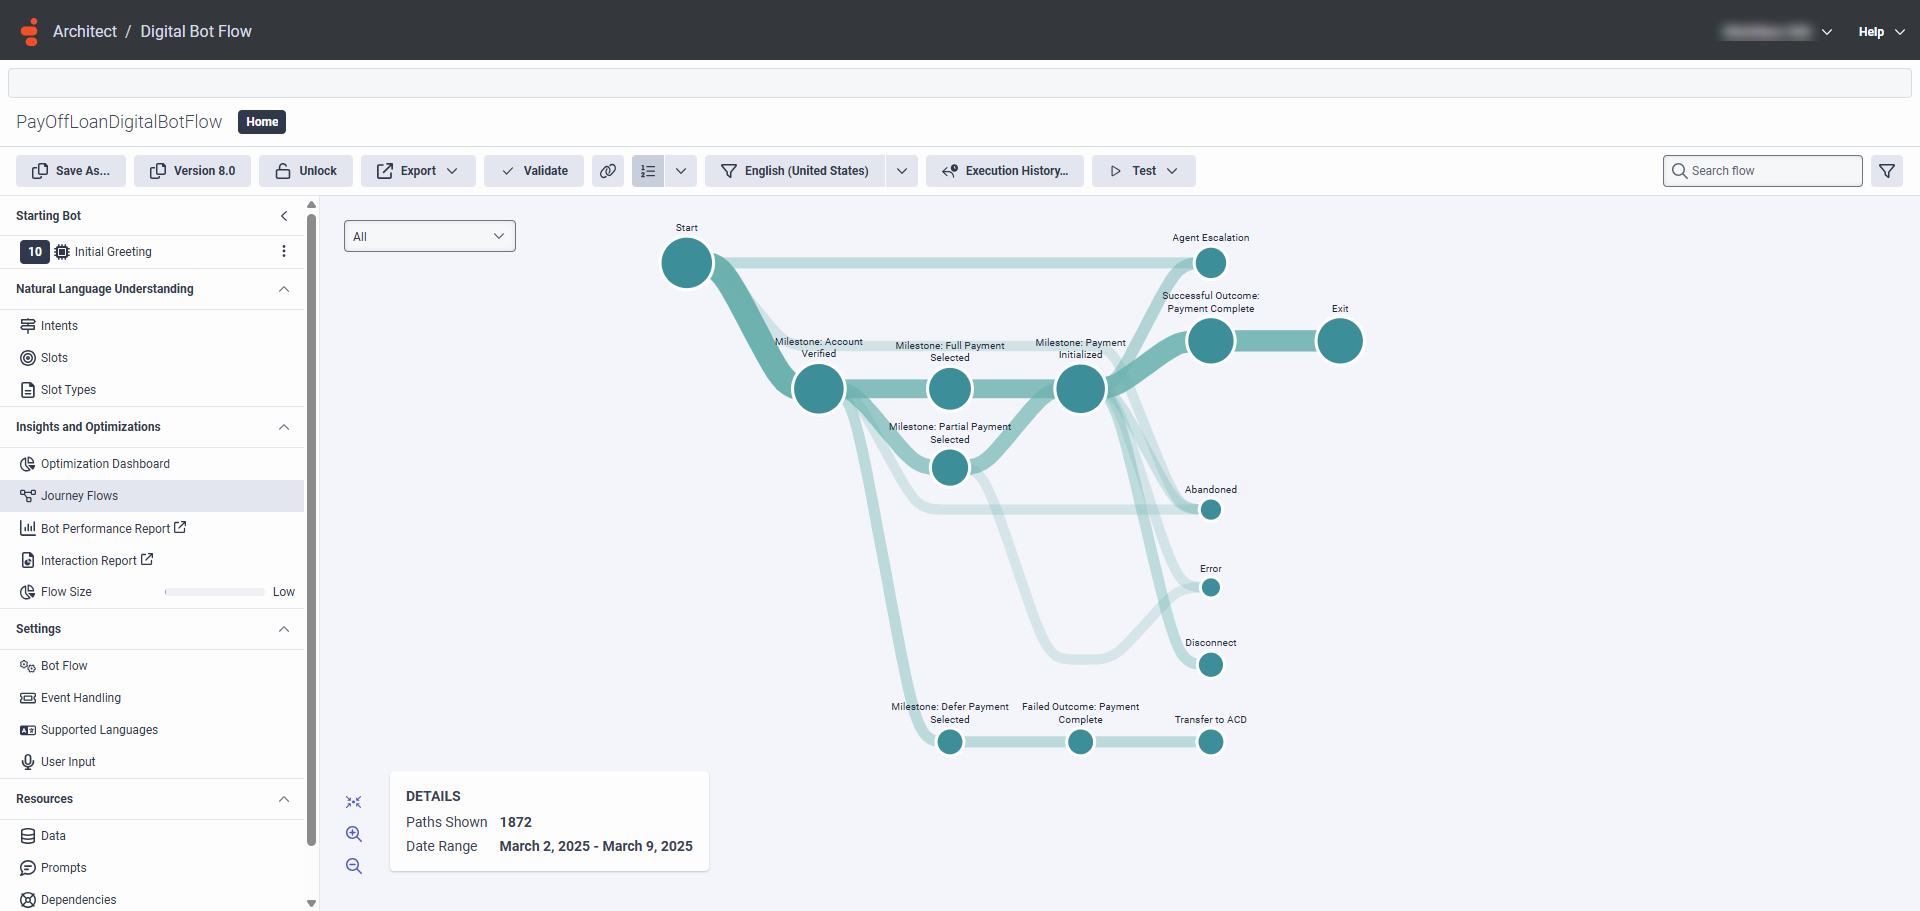
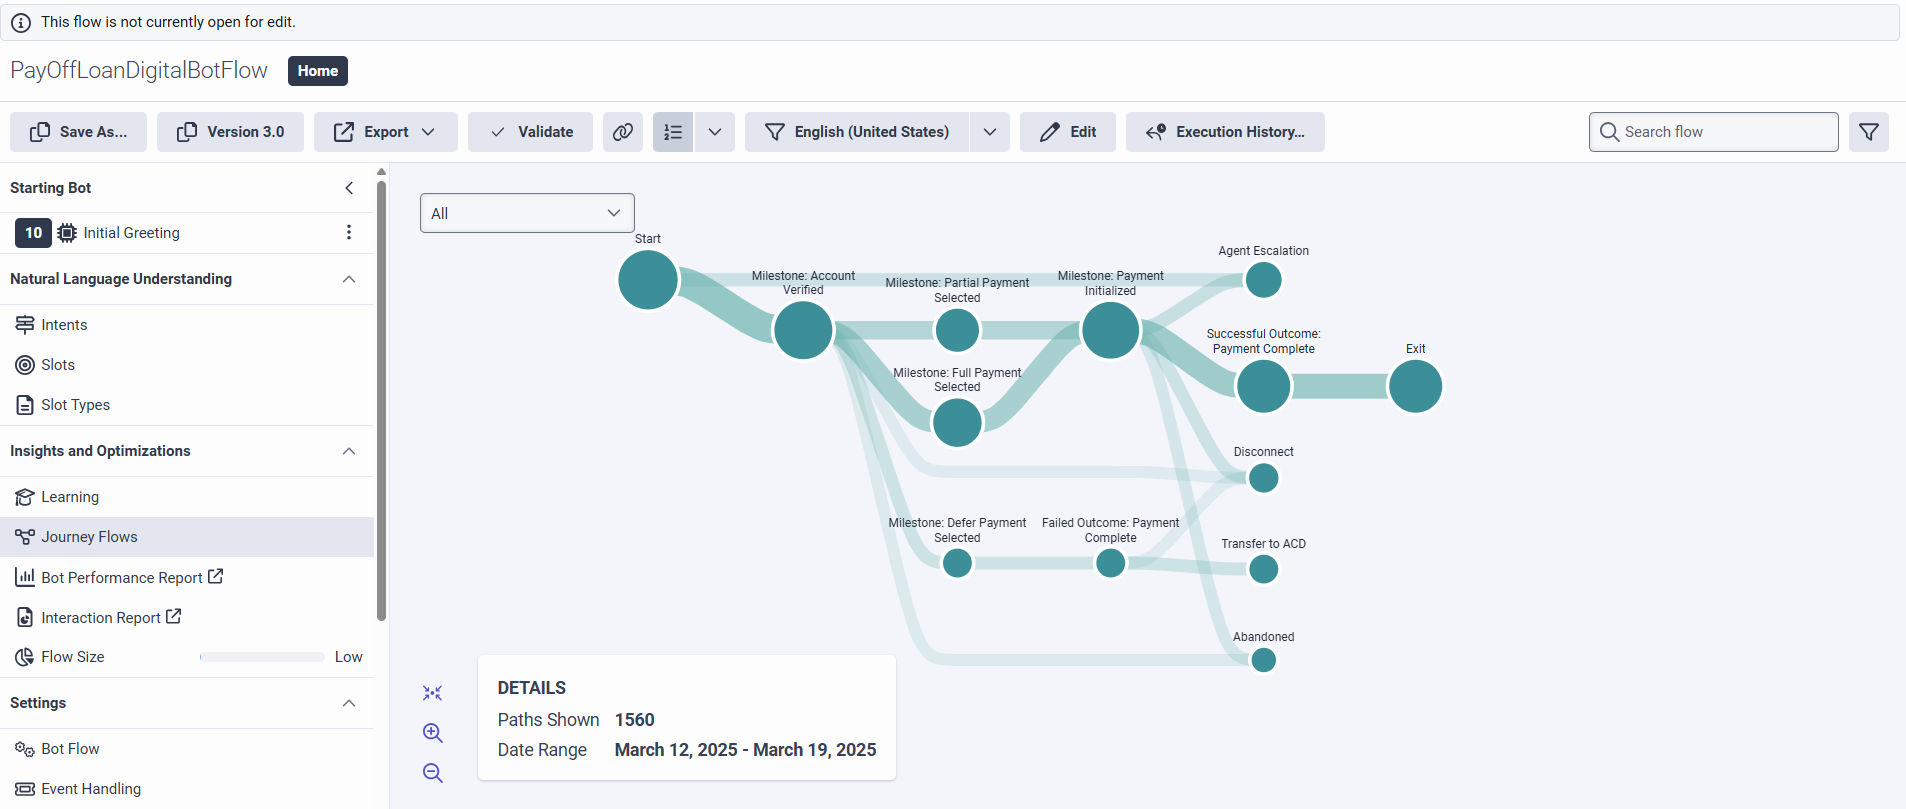
- Klicken Sie im Bereich Menü „Einblicke und Optimierungen“. Der Reiseabläufe Visualisierung öffnet sich. Die Visualisierung zeigt die Verteilung der Kunden entlang der verschiedenen Flow-Meilensteine und -Ergebnisse sowie die verschiedenen Flow-Ausstiegsgründe. Die Visualisierung zeigt auch, wie die Customer Journey in jeder Phase des Ablaufs verlief:
- Als nächstes, weil Sie wissen möchten, wie viele Kunden gingen zum Zahlung initialisiert Meilenstein: Bewegen Sie den Mauszeiger über den Meilenstein, um die Häufigkeitszählung anzuzeigen:
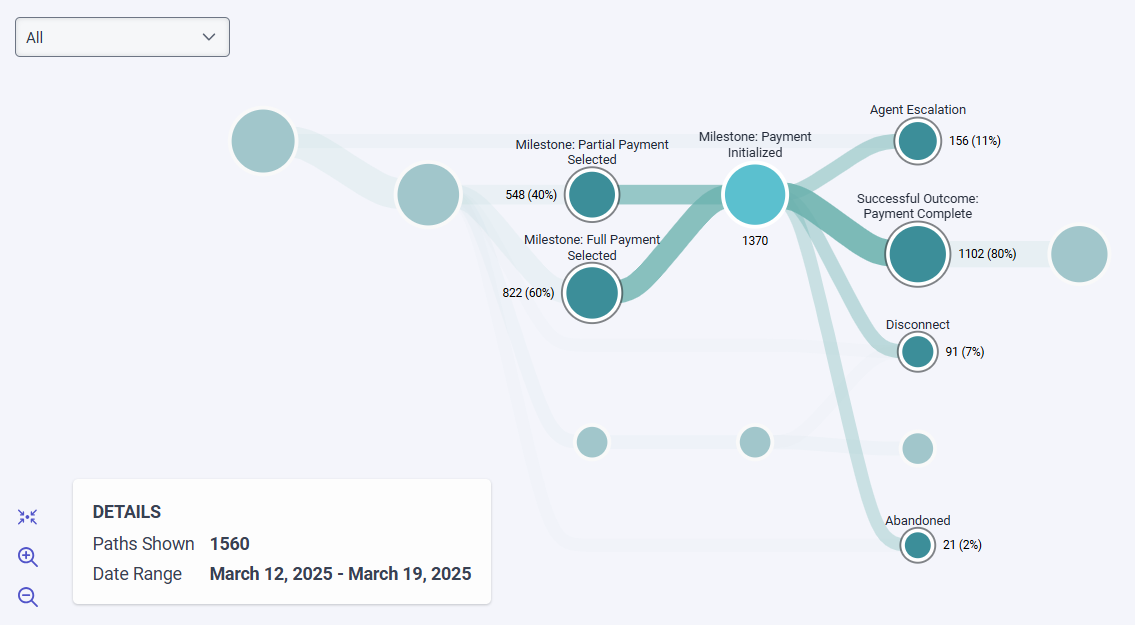
- Nun wollen wir untersuchen, warum 11 Prozent der Kunden, die die Zahlung initialisiert Meilenstein bat darum, mit einem menschlichen Agenten zu sprechen, und sieben Prozent der Kunden beendeten das Gespräch, verwenden Flow-Einblicke um eine Heatmap der Digitalmenü-Optionen in Ihrem Menü „Anfangseinstellungen“ zu erstellen oder verwenden Sie Wiedergabemodus um Ausführungsinstanzen Ihres Flows zu überprüfen.
- Als nächstes untersuchen Sie Sitzungen, die Verlassen .
Gewinnen Sie aussagekräftige Einblicke in Ihre Customer Journeys mit Wiedergabemodus :
Die wichtigsten Vorteile auf einen Blick
Wichtige Anwendungsfälle im Detail
Umsetzbare Erkenntnisse
- Klicken Sie auf der Architect-Startseite auf oder bewegen Sie den Mauszeiger über das Flüsse und wählen Sie einen Flusstyp aus, für den historische Ausführungsdaten verfügbar sind.
- Öffnen Sie den Flow, den Sie zuvor zum Debuggen und Beheben von Problemen ausgeführt haben.
- Klicken Sie auf Ausführungsverlauf. Das Dialogfeld Verlauf der Flussausführung wird geöffnet.
- Unter Results listet Architect frühere Ausführungsinstanzen der von Ihnen geöffneten Strömung auf und liefert den Namen, die Version, den Strömungstyp sowie die Start- und Endzeit der Strömungsinstanzen.
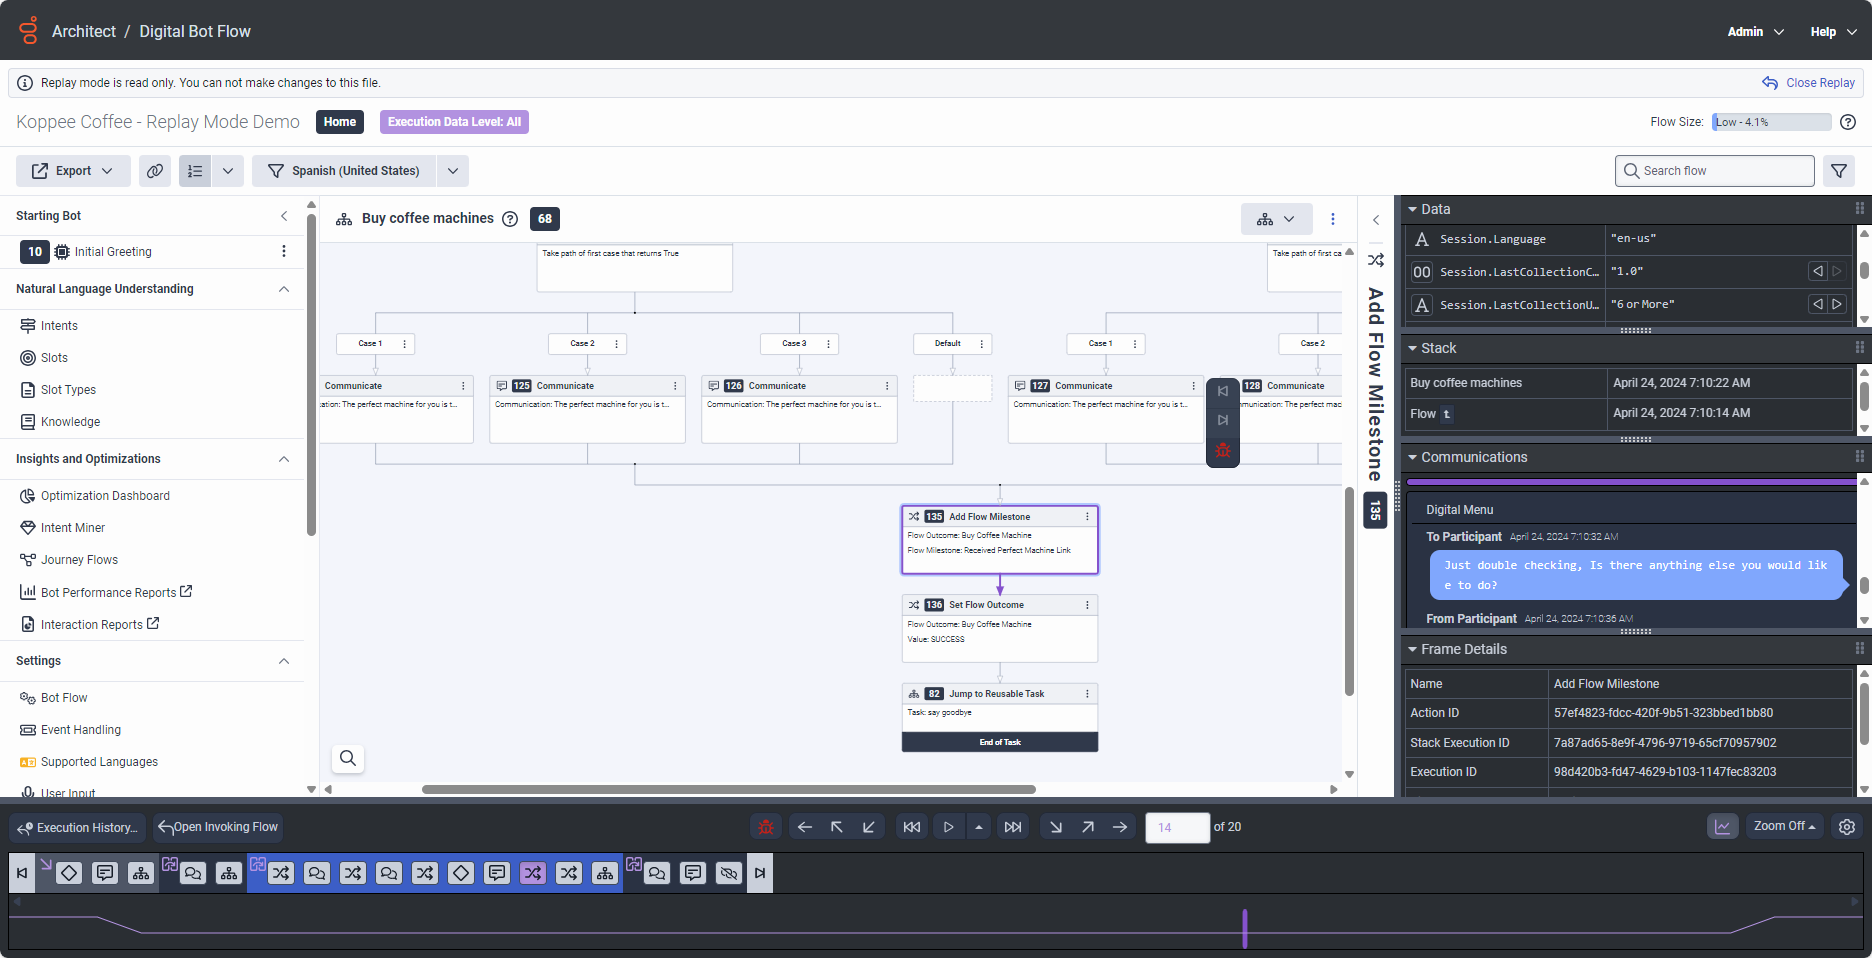
- Klicken Sie auf eine Flussinstanz, um die Instanz im Wiedergabemodus zu öffnen. Weitere Informationen finden Sie unter . Verwenden Sie den Wiedergabemodus zur Fehlersuche in einem Architect-Flow.
- Verwenden Sie die Wiedergabesteuerung, um den Fluss schrittweise durchzugehen und die Abfolge der Aktionen wiederzugeben, die zu der spezifischen Flusskomponente führen, die Sie analysieren möchten.
- Wenn die erforderlichen Ausführungsdaten verfügbar sind, überprüfen Sie den Kommunikationsaustausch und prüfen Sie auch die Variablenwerte, um das Problem mit der Flusskomponente zu ermitteln.
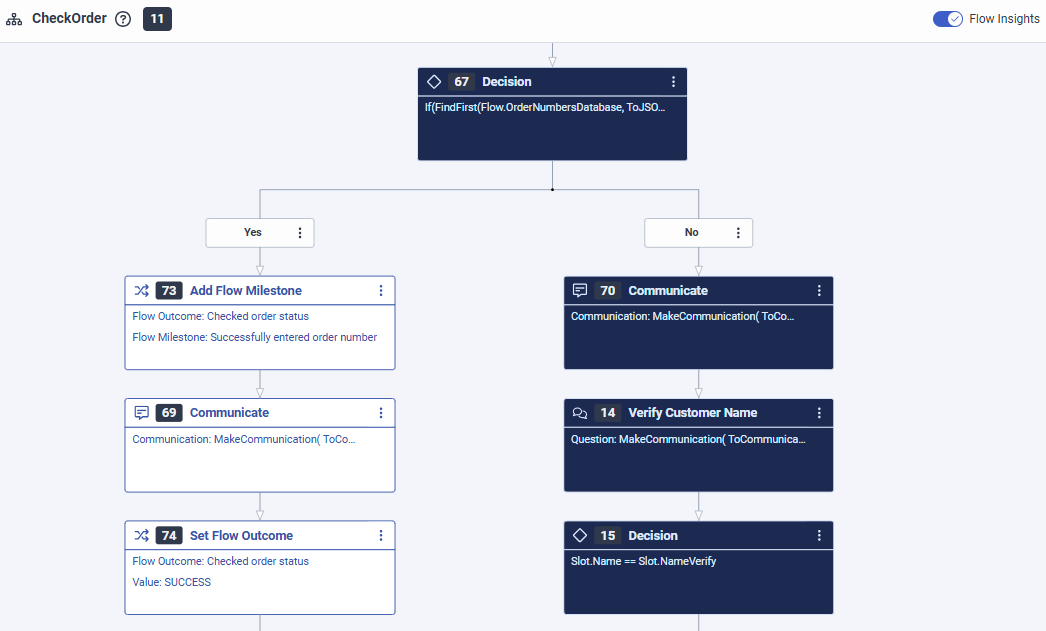
Im folgenden Beispiel für einen digitalen Bot-Flow geben Kunden ihre Bestellnummer ein, um den Status ihrer Bestellung zu überprüfen, aber der Bot erkennt die Nummer nicht.
- Der Flow-Designer verwendete eine Fragen Sie nach Slot-Aktion zur Überprüfung der Bestellnummer und verwendete einen Steckplatz vom Typ
builtin:anyum die Eingaben des Kunden zu speichern. - Nachdem der Bot die Eingabe erhalten hat, geht der Fluss weiter zu einem Entscheidungsaktion das den Ausdruck verwendet
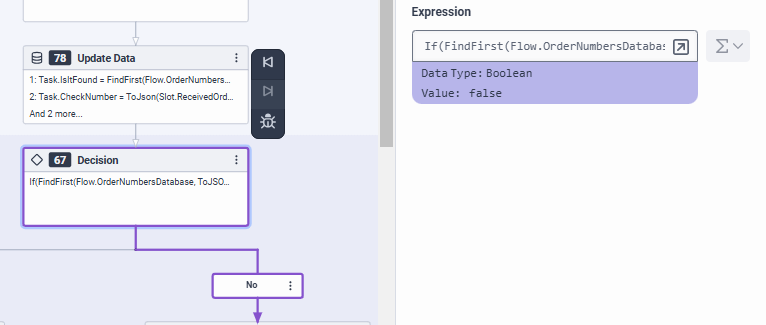
If(FindFirst(Flow.OrderNumbersDatabase, ToJSON(Task.CheckNumber))==-1, false, true)um festzustellen, ob das Array der vorhandenen Bestellnummern, die imFlow.OrderNumbersDatabaseVariable enthält die vom Kunden eingegebene Bestellnummer (Task.CheckThisNumber).
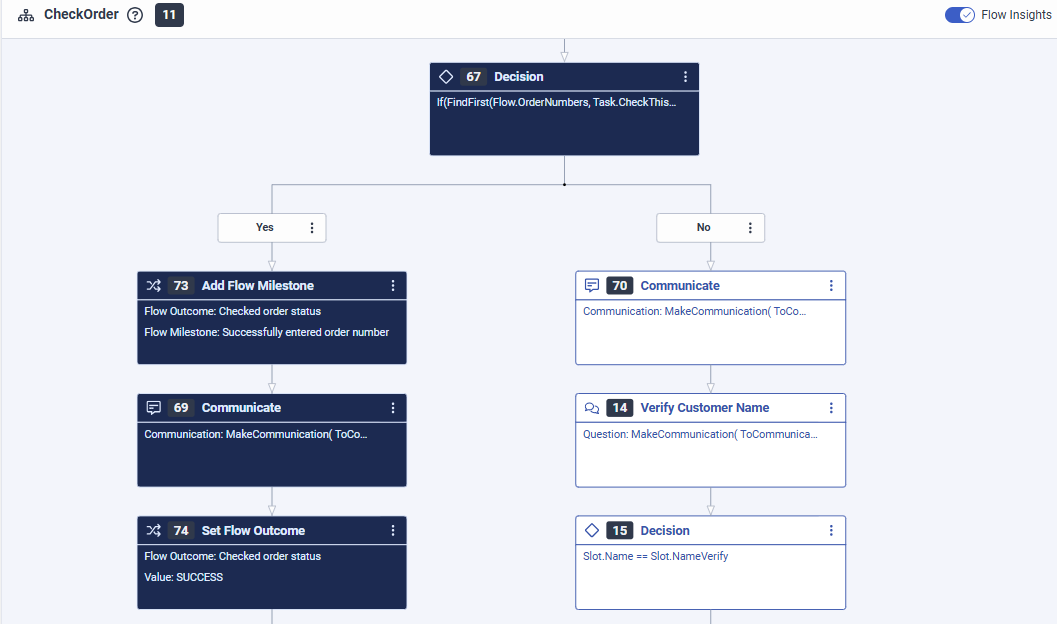
Die Heatmap-Analyse von Flow Insights zeigt, dass die Entscheidungsaktion geht immer den unglücklichen Weg:
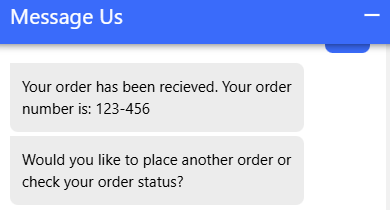
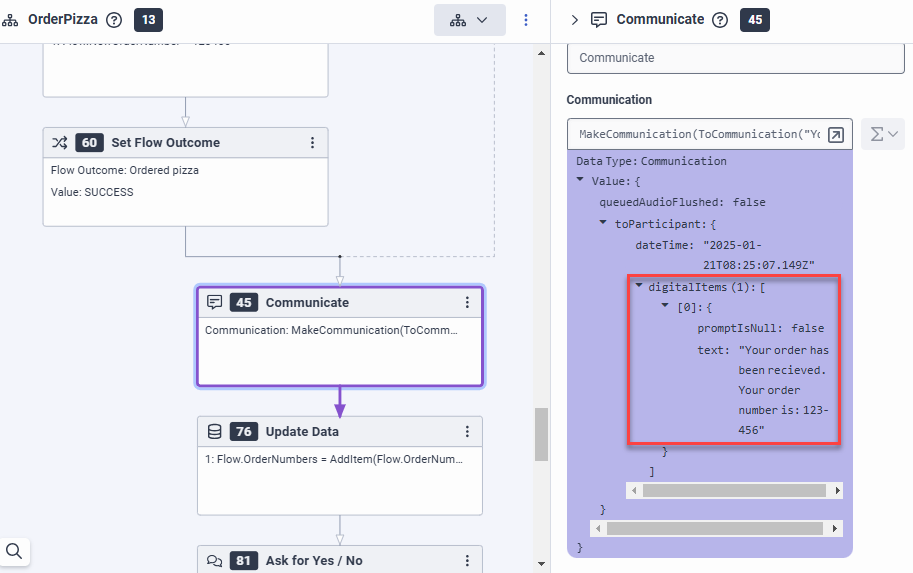
Der Replay-Modus von Architect bietet den Schlüssel zum Verständnis, warum dies geschieht. Der Bot verwendet ein Muster im Format###-### um die Bestellnummer für Kunden anzuzeigen, wobei jeder# stellt eine Ziffer (0–9) dar und- ist ein Bindestrich als Trennzeichen. Das gruppierte Format ist für Kunden ein vertrautes Muster, das die Fehlerwahrscheinlichkeit im Vergleich zu einer langen Ziffernfolge verringert und das Lesen und Merken der Nummer erleichtert.
Das Erkennungsproblem tritt auf, weil der Bot die Bestellnummer in der###-### Format, aber der Bot erwartet als Benutzereingabe eine Ziffernfolge ohne Bindestriche (siehe die Bestellnummern imFlow.OrderNumbersDatabase Variable). Diese Nichtübereinstimmung im Flussdesign führt zu Erkennungsfehlern.
Der Wiedergabemodus ergab, dass der Bot Striche in der Kundeneingabe verarbeiten muss. Um das Erkennungsproblem zu beheben, verwenden Sie einen Regex-Slot-Typ mit dem Muster^\d{6}$|^\d{3}-\d{3}$ um das Eingabeformat zu validieren und alle Bindestriche zu entfernen, bevor Sie die Bestellnummer mit der Bestelldatenbank abgleichen.
Gewinnen Sie aussagekräftige Einblicke in Ihre Customer Journeys mit Reisemanagement :
Die wichtigsten Vorteile auf einen Blick
Wichtige Anwendungsfälle im Detail
Umsetzbare Erkenntnisse
Angenommen, Sie sind ein Contact-Center-Analyst, der die Effektivität von Bots beurteilt, die für Social-Media-Anwendungen entwickelt wurden. Ihr Ziel ist es, die Anzahl der Kunden zu vergleichen, die eine Lösung durch Bots im Vergleich zu menschlichen Agenten erreichen ( ACD ). Verwenden Sie zur Erledigung dieser Aufgabe die Funktionen des Journey Analyzer.
- Melden Sie sich bei Ihrem Genesys Cloud-Konto an und klicken Sie auf das Reisemanagement Speisekarte. Der Reisemanagement Bildschirm öffnet.
- Erstellen Sie eine neue Reise .
- Betreten Bearbeiten Klicken Sie auf, um den Modus anzuzeigen und eine Reise zu ändern Bearbeiten .
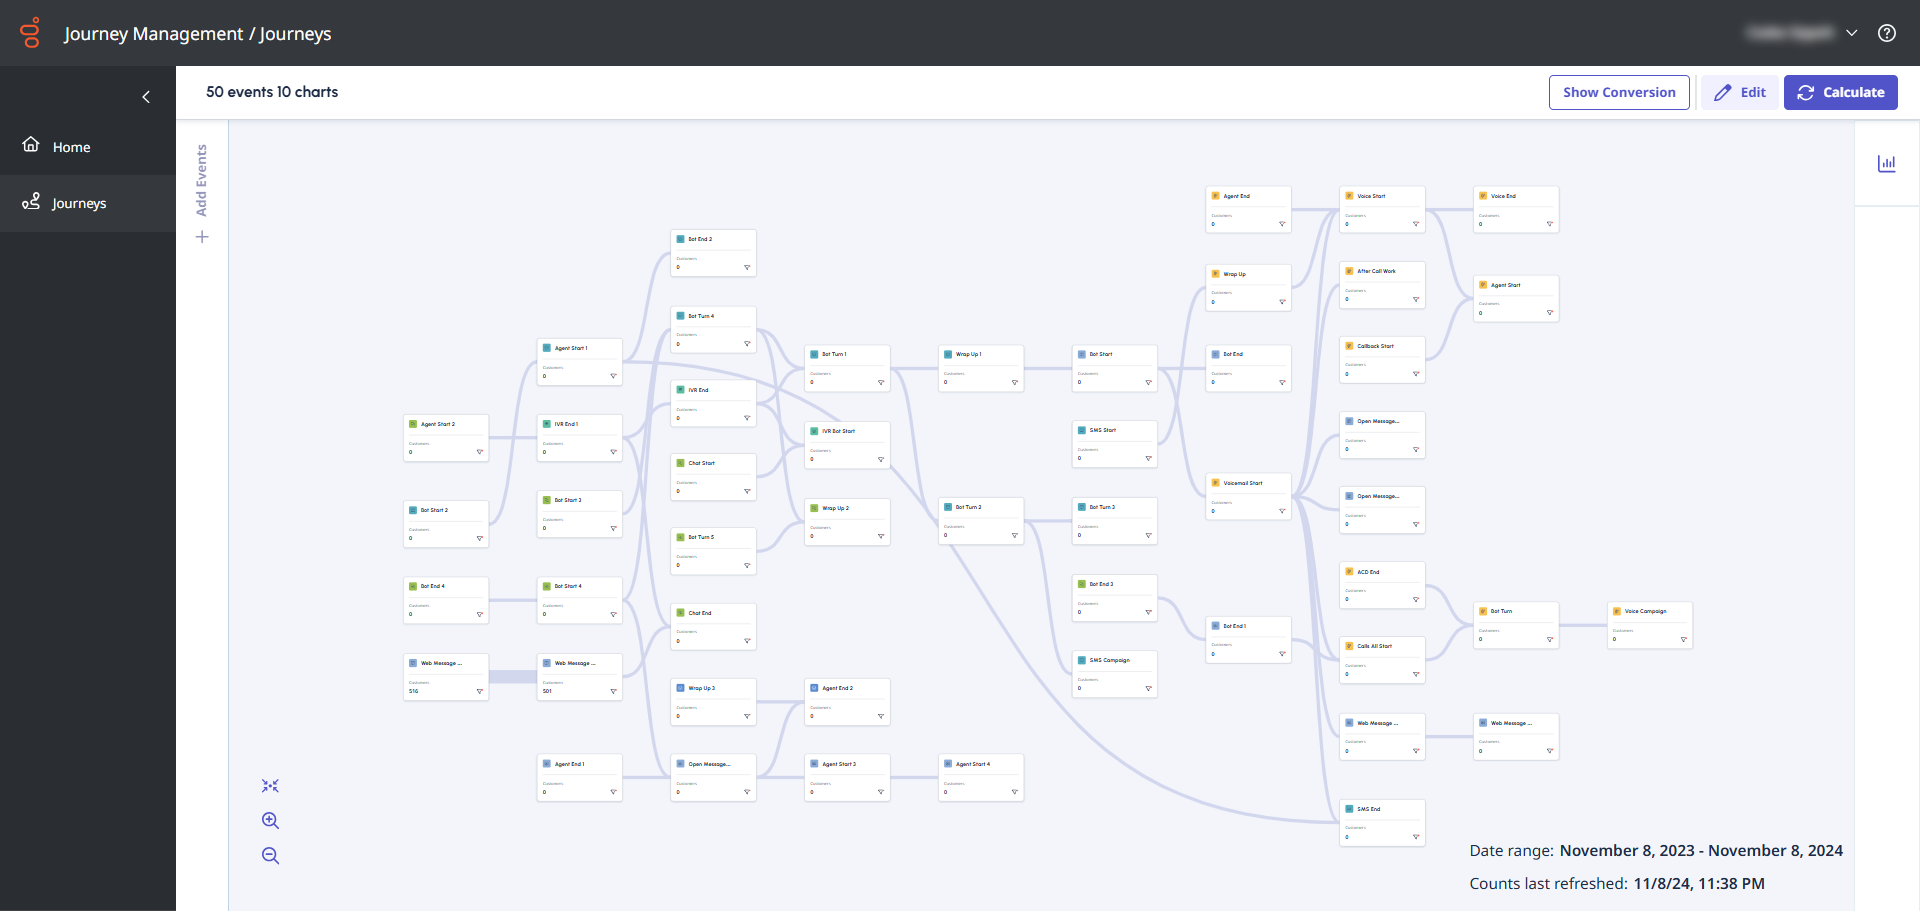
- Reiseereignisse richten Sie sich nach der Arten von Aktionen, die während einer Interaktion ausgelöst werden. Do Das Ereignis „Customer Start“ wird ausgelöst, wenn ein Kunde mit einem Kanal interagiert . Ziehen ein Kundenstart Ereignis und filtern Sie es nach dem sozialen Kanal, den Sie messen möchten .
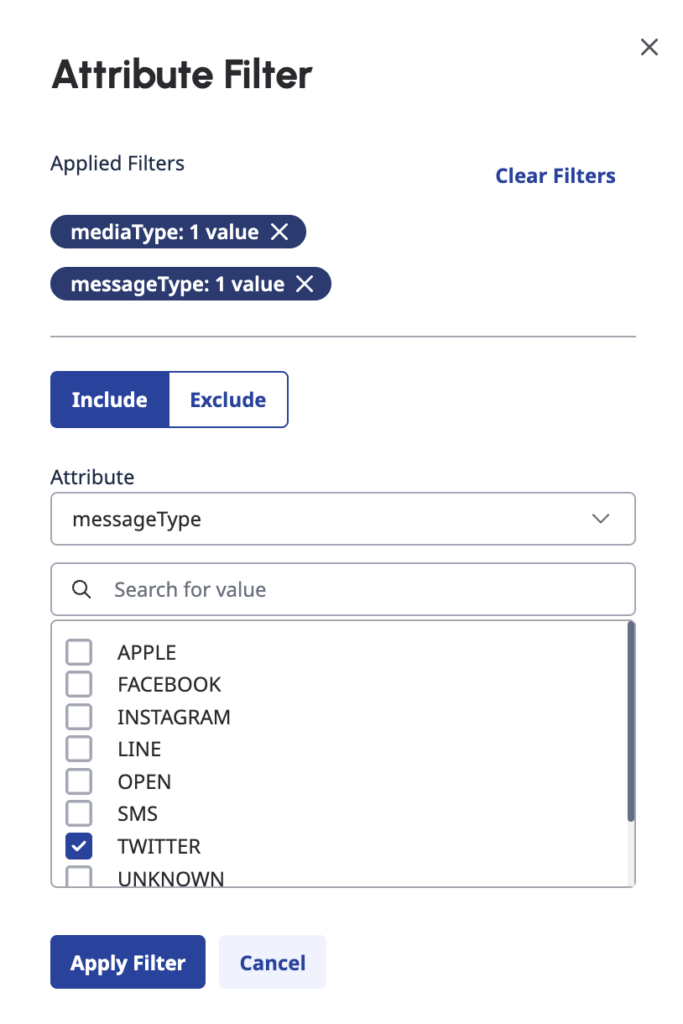
- Öffnen Sie die Veranstaltung, klicken Sie auf das Filtersymbol und wählen Sie Folgendes aus:
- Medientyp - Nachricht
- Nachrichtentyp - Die sozialen Kanäle, die Sie messen möchten
- Fügen Sie diesem Ereignis auf der Leinwand einen beschreibenden Namen hinzu, beispielsweise: Ein soziales Engagement begonnen nt auf Twitter.
- Als nächstes, weil Sie wissen möchten, wie viele Kunden gingen zu Bot-Start nachdem sie ihr soziales Engagement begonnen haben, ziehen und ablegen Bot-Start auf die Leinwand und lassen Sie es dann verbinden mit Kundenstart.Tipp : Verwenden Sie die Tabulatortaste auf der Tastatur, um durch die Ereignisliste zu navigieren und das Menü zu verwenden.
- Um das Ereignis auf den Bot-Namen einzugrenzen, fügen Sie den Bot-Namen als Ereignisattributfilter .
Tipp : Den Botnamen finden Sie in Architekt . Journey Management unterstützt native oder Drittanbieter-Bot-Ereignisse, native Bots stellen jedoch detailliertere Daten zur Journey bereit.
- Um das Ereignis auf den Bot-Namen einzugrenzen, fügen Sie den Bot-Namen als Ereignisattributfilter .
- Um nun abgeschlossene Bot-Sitzungen zu prüfen, ziehen Sie Bot End auf die Leinwand und lass es dann verbinden mit Bot-Start .
- Da Sie an demselben Bot interessiert sind, den Sie in Schritt 6 untersucht haben, fügen Sie die Kennung des Bots als Ereignisattributfilter bei dieser Veranstaltung.
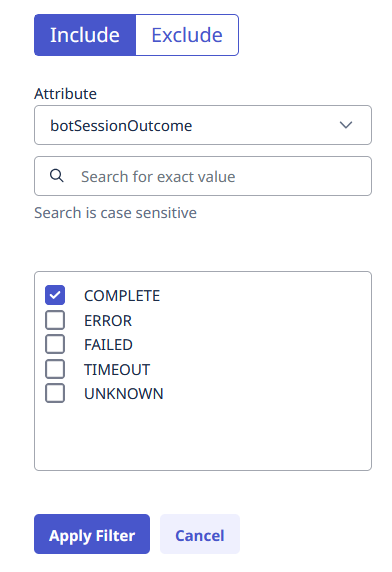
Tipp : Wenn Sie einen nativen Genesys-Bot verwenden, fügen Sie hinzu, um Ihre Analyse auf eine Absicht und andere möglicherweise relevante Interaktionsattribute einzugrenzen Bot Turn zwischen Anfang und Ende. - Um abgeschlossene Bot-Sitzungen anzuzeigen, schließen Sie die BotsessionErgebnis Filter und wählen Sie dann den vollständig Attribut.
- Klicken Filter anwenden .
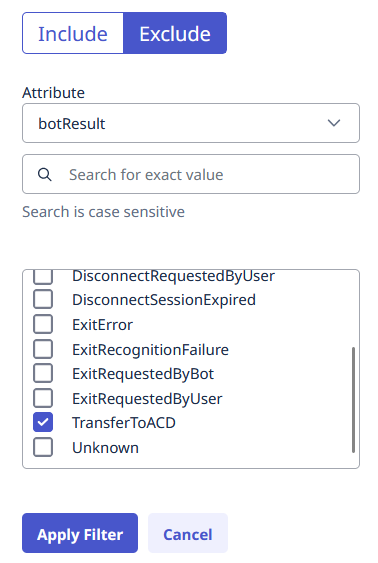
- Da Sie in diesem Fall abgeschlossene Bot-Sitzungen untersuchen und nicht die Sitzungen, die an ACD (Automatische Anrufverteilung) gingen, füge hinzu BotErgebnis Filter im Ausschließen Abschnitt mit TransfertoACD als Wert.
- Klicken Filter anwenden .
- Da Sie an demselben Bot interessiert sind, den Sie in Schritt 6 untersucht haben, fügen Sie die Kennung des Bots als Ereignisattributfilter bei dieser Veranstaltung.
- Untersuchen Sie als Nächstes die Sitzungen, die an ACD gingen. Ziehen Sie t Er ACD-Start Ereignis auf die Leinwand. Lassen Sie es verbinden mit Bot-Start , so dass es parallel ist zu Bot End .
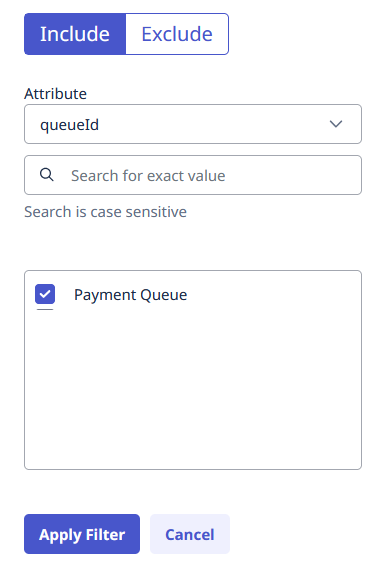
- Wählen Sie in diesem Fall Warteschlangen-ID als Attribut und fügen Sie dann einen Filter für die Zahlungswarteschlange .
- Klicken Sie auf Speichern.
Beispielfahrt berechnen und bearbeiten
- Klicken Berechnen Reisen generieren . Es erscheint eine Meldung über die Anzahl der Berechnungen.
- Um fortzufahren, klicken Sie auf Fortfahren . Die Berechnung dauert einige Minuten. Die Ladezeit hängt vom zu verarbeitenden Datenvolumen ab, sodass die Berechnung größerer Datensätze mehr Zeit in Anspruch nimmt. Aktualisieren Sie die Seite, um die Ergebnisse anzuzeigen.
- Nach Abschluss der Berechnung möchten Sie die Anzahl der von den Agenten gelösten Anrufe erfahren. Um die Reise zu bearbeiten, klicken Sie auf Bearbeiten .
- Ziehen Sie den Agentenstart Ereignis, und lassen Sie es verbinden mit dem ACD-Start Ereignis.
- Fügen Sie einen Filter hinzu für Zahlungswarteschlange . Die Zahlungswarteschlange verfügt über zwei Nachbearbeitungscodes: Erfolg Und Versagen .
- Verfolgen Sie die Agentenlösung mit einem Erfolgsabschlusscode. Aus dem Stimme Ereignisgruppe, ziehen Sie ein Einpacken Ereignis auf die Leinwand und verbinden Sie es mit dem Agentenstart Ereignis. Wählen Sie die Zusammenfassungscode Attribut und enthalten die Kennung des Erfolg Wrap-Up-Code als Filter.
Notiz : Y Sie können die Liste der in Ihrer Umgebung verwendeten Wrap-up-Code-IDs mit dem Wrap-up-API-Endpunkt über den API Explorer , das auf der Genesys Cloud Developer-Site verfügbar ist. - Um anzuzeigen, dass es für die Erfolg Nachbearbeitungscode: Fügen Sie Ihrem After Call Event einen beschreibenden Titel hinzu, beispielsweise „Erfolgreiche Lösung“. .
- Verfolgen Sie die Agentenlösung mit einem Erfolgsabschlusscode. Aus dem Stimme Ereignisgruppe, ziehen Sie ein Einpacken Ereignis auf die Leinwand und verbinden Sie es mit dem Agentenstart Ereignis. Wählen Sie die Zusammenfassungscode Attribut und enthalten die Kennung des Erfolg Wrap-Up-Code als Filter.
- Fügen Sie einen Filter hinzu für Zahlungswarteschlange . Die Zahlungswarteschlange verfügt über zwei Nachbearbeitungscodes: Erfolg Und Versagen .
- Klicken Sie auf Speichern.
- Um die Reise zu aktualisieren, klicken Sie auf Berechnen . Aktualisieren Sie die Seite, um die aktualisierten Zahlen anzuzeigen.
Siehe Funnel-Analyse in der Beispiel-Journey
Mit Hilfe von Trichteranalyse , du kannst Verstehen Sie, wie Ihre Kunden ihre Reise zum Erreichen ihrer Ziele absolvieren, und ermitteln Sie dann die Erfolgsraten ihrer individuellen Reisepfade.
Eine Reise muss Berechnungen zur Trichteranalyse.
- Öffnen Sie die vorhandene Reise, die Sie analysieren möchten.
- In Bearbeitungsmodus auf Konvertierung anzeigen . Journey Analyzer berechnet die Konvertierungsmetriken.
- Um die zugeordneten Metriken zu untersuchen, klicken Sie erneut auf das +-Symbol in der oberen rechten Ecke des Ereignisses. Um die Konvertierungsmetriken eines Ereignisses auszublenden, klicken Sie auf das - Symbol in der oberen rechten Ecke.
- Um die Reise Ihrer Kunden zu bestimmen, untersuchen Sie die Kunden , Konvertierungsrate , Fallengelassen aus Und Vorwärts bewegt Kennzahlen bei den jeweiligen Events.
Beispiel : Die Trichteranalyse im Bot-Start Veranstaltung zeigt, dass 650 Kunden an diesem Punkt die Reise abgebrochen haben und 1052 Kunden Vorwärts bewegt Zu Bot-Ende , Also Bot-Ende hat eine Konversionsrate von 61,7 %. Das bedeutet, dass 61,7 % Ihrer Kunden die Bot-Ende Sitzung.
- Benennen Sie die Ereignisse immer um, damit die Reise für neue Benutzer lesbar ist und zum Szenario passt.
- Mit Journey Management können Sie Ihre eigenen Hypothesen zu User Journeys testen. Zum Beispiel:
- Sie können ein Szenario modellieren, um zu testen, ob die Eskalationsrate von Kunden, die über Bot A laufen, höher ist als die von Kunden, die über Bot B laufen. Sie können mehrere Bot-Start Fügen Sie Ihrer Reise Ereignisse hinzu und legen Sie Attributfilter für Bot A bzw. Bot B fest.
- Sie können die Wirkung der Sprache untersuchen. Messen Sie beispielsweise, ob Kunden, die mit einem englischsprachigen Bot interagieren, Interaktionen genauso erfolgreich abschließen wie Kunden, die mit einem französischsprachigen Bot interagieren. In dieser Analyse können Sie den Sprachfilter im Bot-Start Ereignis.
- Sie können arbeiten mit Reiseabläufe um Muster innerhalb von Flows anzuzeigen und festzustellen, ob es Probleme gibt, die Sie untersuchen möchten. Wenn Sie beispielsweise Eskalationen sehen, verwenden Sie Journey Analyzer, um die Art der Eskalation, die Häufigkeit und das Ergebnis zu verstehen.
Hinweis: Journey Management und Journey Flows sind zwei leistungsstarke Tools, die sich gegenseitig ergänzen können, es jedoch einige Unterschiede zwischen ihnen gibt. Weitere Informationen finden Sie unter Unterschiede zwischen Journey Management und Journey Flows . - Leistungsansichten können Ihnen auch dabei helfen, Ihre Analysen zu unterstützen. Flow-Ergebnisse in Architekt, der Warteschlangen-Leistungsansicht oder die Interaktionsansicht im Arbeitsbereich.
- Der AppFoundry bietet mehrere Vorlagen, die Sie für den Einstieg verwenden können.

